Bitcoin’s Data Models are Dead? Hardly
Some think 2021 killed data models of bitcoin’s price because pretty much every prediction failed.
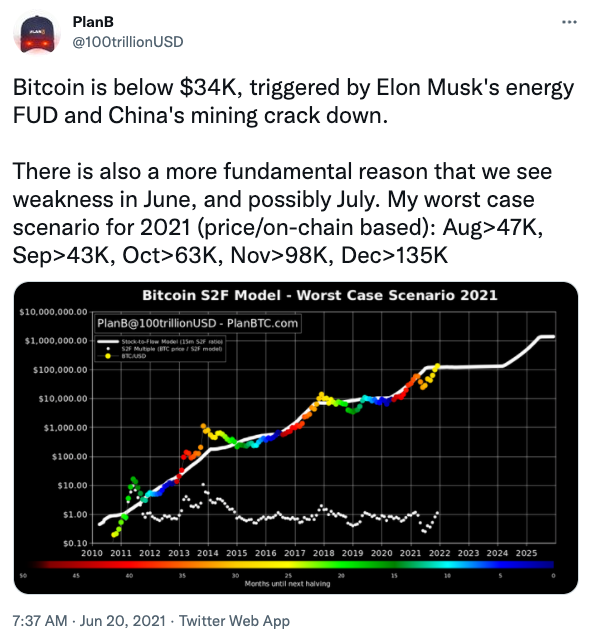
Stock-to-Flow promised $135,000 in December 2021 as a “worst-case scenario.”

Oops.
Bob Loukas’s Four-Year Cycle missed both the time and price of the cycle peak in 2021.
The current halving cycle doesn’t align with previous ones and logarithmic growth charts missed their targets.
Depending on who you ask, expanding cycles missed the peak (either April or November 2021, not sometime in the future, as predicted).
Fractals from 2013 and 2017 bombed, too.
Does this mean data models are dead?
Not likely.
Perhaps 2021 killed blind faith in speculative theories, but the data models still persist. Dismiss them at your peril.
All within range
Data models leave a pretty wide margin for error.
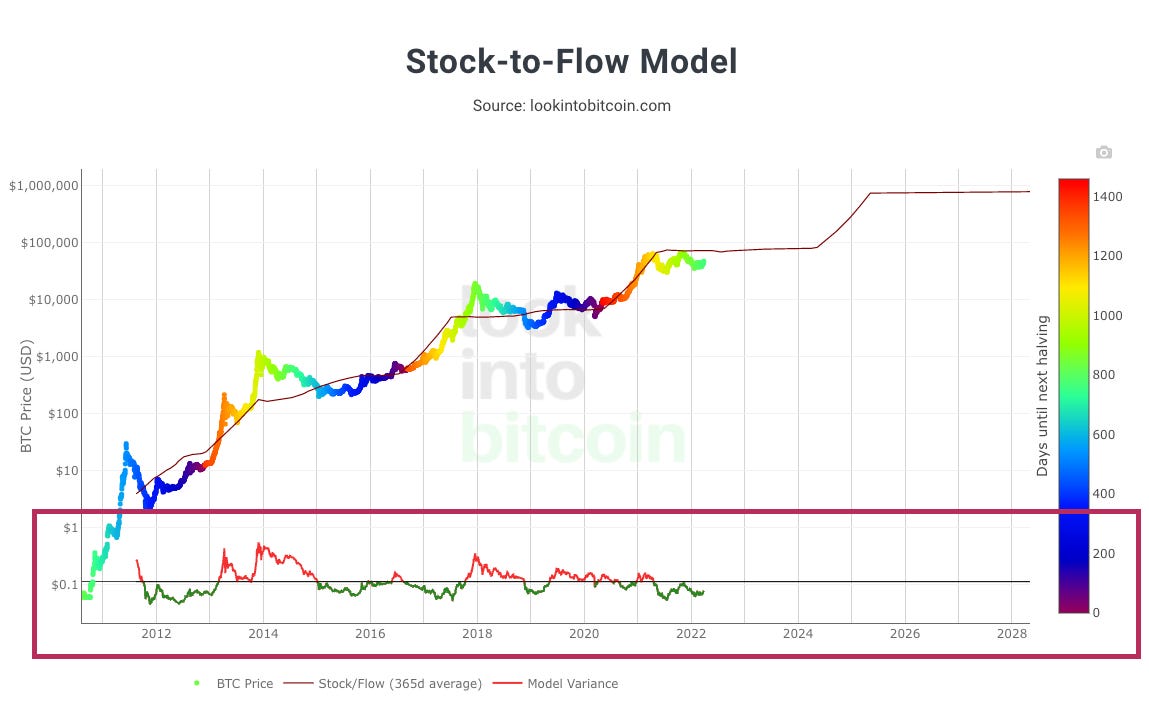
Over the course of bitcoin’s history, its price has gone 400% higher and 70% lower than S2F’s predicted prices for months at a time—including over the past few months. You can see this in LookIntoBitcoin’s “model variance” in the rectangle below.

S2F is as valid now as it ever was.
Four-year cycles can be left- or right-translated. In other words, peaks and bottoms can come at any time or price.
Halving cycles have never shown many similarities in the timing or extent of price movements from one cycle to the next.
Logarithmic growth curves don’t specify the timing of peaks or bottoms and their creators constantly adjust them as time goes on.
The expanding cycle theory fits all of the peaks and bottoms—if only we could all agree on what’s a “peak” and a “bottom.”
Maybe you’re reading too much into the data models?
High expectations are never met
These models allow for so much deviation, you can’t disregard them just because the market strays from expectations. They’re all basically guessing about the future. Appreciate them for what they are and the insights they provide.
Unless you have a better way to visualize this market’s likely growth trajectory? I don’t.
When the market goes up a lot and then drops, people think it’s a peak. When the market drops a lot and then goes up, people think it’s a bottom.
I just call that “normal” for a market that's been known to go up 100-300% in bear markets and drop 30-50% in bull markets.
With such volatility, you need to give these models a lot of slack. They offer perspective and a way to conceptualize a noisy, speculative, challenging market.
At the end of the day, you get to believe whatever you want. Try hard enough, you’ll find a data model that fits.
Who knows? It may even be right.
Mark Helfman publishes the Crypto is Easy newsletter. He is also the author of three books and a top bitcoin writer on Medium and Hacker Noon. Learn more about him in his bio.
Originally published on Cryptowriter.
Appreciate the creator